
Pharmacy (PharmD)
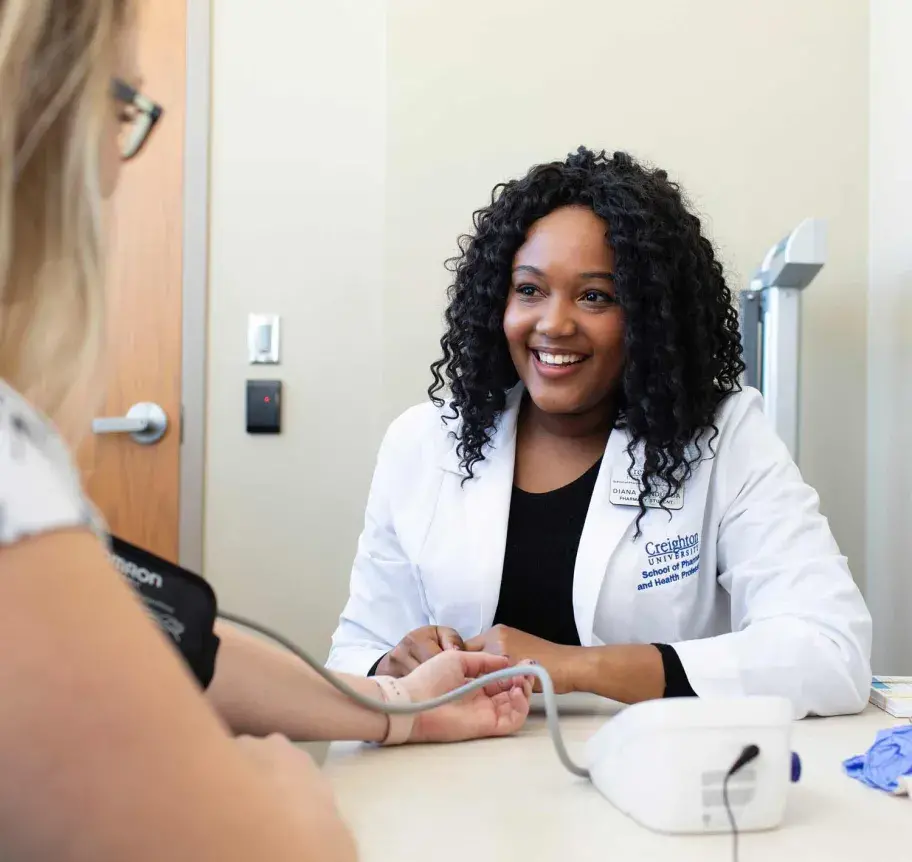
Join Creighton’s Doctor of Pharmacy program and join a community for those called to care. Our nationally ranked program will prepare you to provide excellent, informed, patient-centered care. Here, we combine science and medicine with a spirit of service and compassion. We offer three distinct pathways within the program: You can study on campus in Omaha, choose our distance pathway or opt for a hybrid learning experience in Phoenix.
Creighton’s innovative PharmD program reflects the latest developments in the practice of pharmacy regarding medication therapy management and patient-focused care. In this four-year program, you’ll expand your knowledge of disease management and prevention, patient outcomes and wellness.
Graduates are well positioned for employment in a wide range of health service settings, including private businesses, hospitals, clinics, government, military and academic and research institutions.


Accredited Online Pharmacy Program in the U.S.
Median annual wage for pharmacists in 2023
-U.S. Bureau of Labor Statistics
pharmacy program, per U.S. News & World Report
PharmD Program Details
Creighton’s Doctor of Pharmacy program is a full-time, four-year program beginning in August each year.
Inspired by the Catholic and Jesuit tradition, our Creighton community believes each human being is a profound gift from God, deserving of dignity and opportunity. Here, you’ll learn to provide the best possible medication-related care to improve a patient’s quality of life.
Today’s pharmacy education focuses on:
- Patient data collection
- Medication therapy management and delivery
- Pharmacy care planning
- Patient counseling
- Patient monitoring and compliance
- Patient outcomes evaluation and documentation
PharmD Curriculum and Experiential Learning
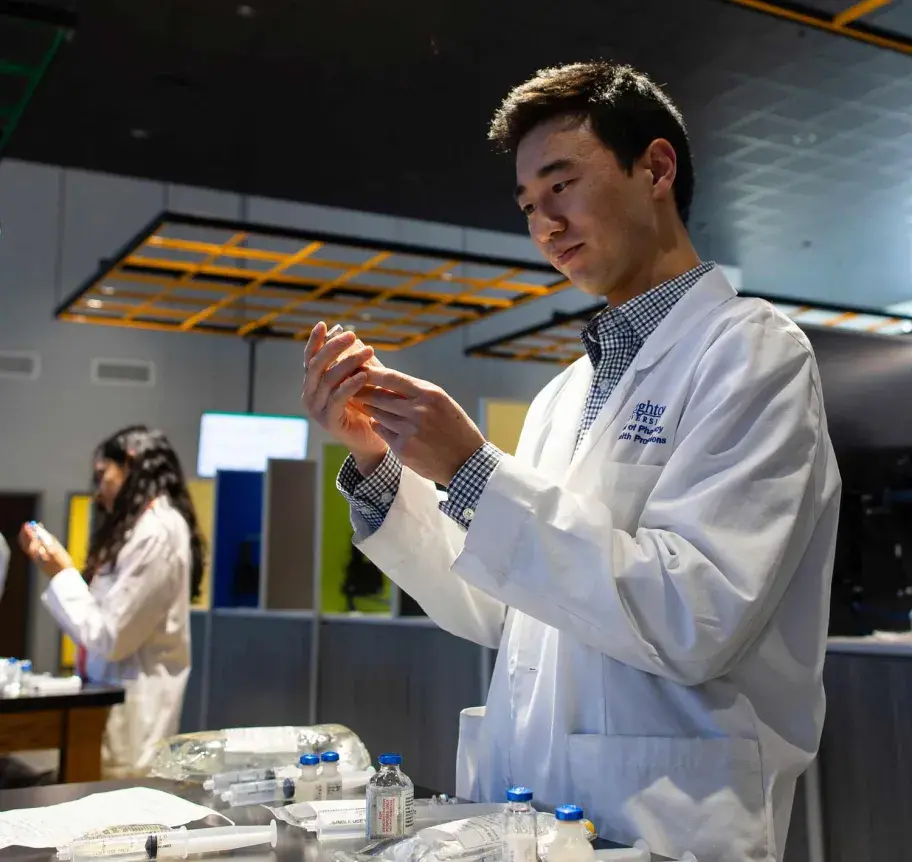
The first three years of the four-year PharmD program consist of didactic coursework, Pharmacy Skills Labs and Introductory Pharmacy Practice Experiences (IPPEs).
Upon graduation, you’ll be able to provide care in collaboration with patients, prescribers and other healthcare providers based upon sound therapeutic principles, evidence-based data and research.
The fourth and final year is composed of 40 weeks of Advanced Pharmacy Practice Experiences (APPEs) from June until May (three semesters). Experiential education comprises approximately 30% of the curriculum.
IPPE students are introduced to various pharmacy practice settings, with an emphasis on hospital and community settings, which lay the foundation for Advanced Pharmacy Practice Experiences (APPEs).
- Year 1
IPPE 1: Six four-hour shadow visits - Summer of Year 1
IPPE 2: Three-week community setting - Summer of Year 2
IPPE 3: Three-week hospital setting - Spring of Year 3
IPPE 4: 32-hour clinical
During the fourth year, students complete eight five-week APPEs (rotations) on a full-time basis. The required APPEs include:
- Community Pharmacy Practice
- Hospital Pharmacy Practice
- Acute Care
- Ambulatory Care
- Drug Information or Medication Therapy Management
Creighton’s Office of Experiential Education manages Introductory and Advanced Pharmacy Practice Experiences (IPPEs and APPEs/rotations) for pharmacy students throughout the curriculum. The office’s database includes over 1,000 pharmacy practice sites across the country. Students have opportunities in all 50 states. Preceptors at these sites are highly trained pharmacists with expertise in their specialty area of pharmacy practice.
Cross-Cultural Programs
As a pharmacy student at Creighton University School of Pharmacy and Health Professions, you’ll have multiple opportunities to provide healthcare to underserved individuals around the world.
The IRD Curriculum Model
The content, skills and outcomes of the curriculum are purposefully structured around a spiraling Introduce-Reinforce-Demonstrate (IRD) curricular model.
The IRD model builds competence by structuring learning in a purposefully integrated cycle of increasing complexity. Each course identifies specific learning objectives that are tied to the relevant educational outcomes and denotes competencies to be introduced (I), reinforced (R) and/or demonstrated (D).
Professional licensure requirements are determined solely by each state and may change without notice to Creighton. While our information is updated annually, Creighton cannot guarantee continuous accuracy. Current and prospective students can find program-specific PDFs on our Academic Regulations page or consult the appropriate licensing agency in the state where they plan to practice to confirm updated requirements for their program.
Creighton also cannot guarantee that any student will attain state-established licensure or certification in any field or jurisdiction.
Schedule a Visit
Learn about the program, admissions, prerequisites, clinical education experiences and more below. You can also discover if Creighton is the right fit for you by scheduling a personalized campus visit.

Pathways
Omaha, Nebraska
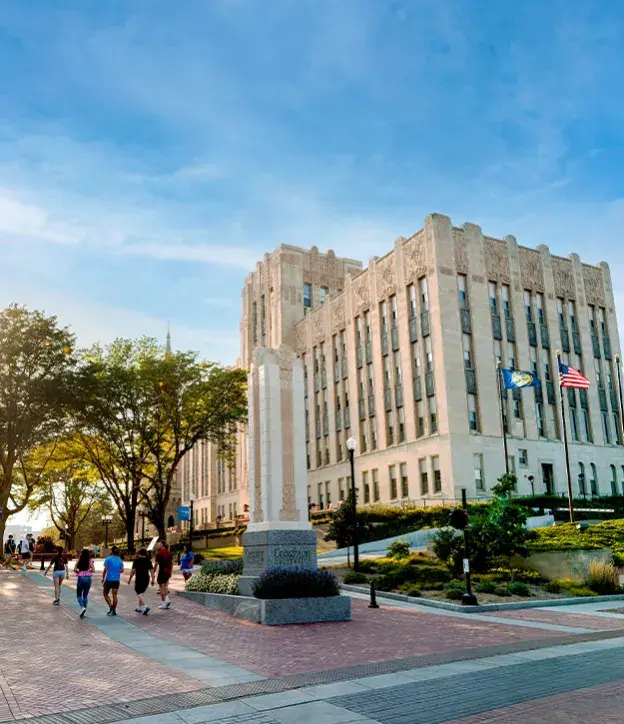
Students in the Omaha pathway earn their degree in a full-time traditional campus setting. The learning environment includes board-certified pharmacy faculty committed to interprofessional research collaboration, a state-of-the-art skills lab and clinical experience across the country.
Phoenix, Arizona

Students in the hybrid PharmD program in Phoenix participate in lectures online and complete hands-on learning at our interprofessional campus in the Phoenix Medical Quarter. The pathway covers the same material as the traditional Omaha campus program but offers students the flexibility of hybrid learning.
Students can stream the didactic lectures live from our Omaha campus or watch the recordings later in the day. Students then come to our Phoenix campus a few days each week for in-person labs. The Phoenix campus offers state-of-the-art facilities to our Pharmacy students as they complete the clinical lab portion of the curriculum.
Creighton has partnered with Dignity Health St. Joseph’s Hospital and Medical Center, Valleywise Health and District Medical Group, Inc. to form the Creighton University Arizona Health Education Alliance, which gives Creighton students access to hands-on experiences in these prominent Phoenix healthcare facilities.
Distance Pathway

Creighton launched the first accredited web-based distance PharmD pathway in the country in 2001. The pathway covers the same material as the traditional Omaha campus program but offers students the flexibility of completing coursework online.
In this pathway, students interact with faculty and mentors via web conferencing software, discussion boards, email, phone and other media. The didactic coursework is taught on a semester basis. Some elements of the distance pathway are synchronous (live), while others are asynchronous.
Distance students are required to come to the campus in Omaha a total of five times. The first is a week of welcome and orientation before the pharmacy program begins. Then, distance students will be on campus two weeks each summer of the program for hands-on Pharmacy Skills Labs. Lastly, distance students will come back to campus their fifth and final time for hooding and commencement ceremonies in May of their graduating year.
The clinical component of the distance pharmacy pathway is the same as the campus pharmacy pathway. A total of eight five-week clinical rotations are required, five of which are in required subject areas, with the remaining three in elective subject areas. Sites for clinical rotations are available in a variety of locations throughout the country and internationally.
Admissions Requirements
To apply, submit an online application and supporting materials through PharmCAS, the centralized pharmacy application service. Supporting application materials include:
- An official transcript, which must be received directly from each institution the applicant has attended and/or is currently attending.
- All fall/winter term and prior transcripts should be directed to PharmCAS.
- All spring/summer term transcripts should be directed to the Creighton Enrollment Services.
- Two letters of recommendation (submitted through PharmCAS). We prefer that one letter come from a college professor who can attest to your ability to enter a competitive, professional program. If you have been out of school for some time, letters from a work setting can be helpful. Do not submit letters from family members or friends.
The PCAT is not required for consideration for admission.
Applicants should only apply to one pathway per admission cycle. Applying to more than one pathway does not increase an applicant’s chances for admission.
PharmD Interviews
The admissions process includes an interview. Applicants are encouraged to apply early. Fulfillment of basic requirements does not guarantee an interview or admission. The Pharmacy Admission Committee selects the applicants from a pool of applicants it considers best qualified for the study and practice of the profession. Admission is based on rigor of coursework, quality of academic institution, cumulative GPA, prerequisite science and math GPA, recommendations, applicant statement and interview.
Prerequisites
A degree is not required to be considered for the Doctor of Pharmacy program.
For admission into the Doctor of Pharmacy program at Creighton, you need to meet the following requirements:
- A minimum of 63 semester hours or 95 quarter hours of prerequisites.
- Prerequisite courses must be completed at a regionally accredited institution located within the United States and must be completed with a grade of C or better (a C- grade is not acceptable). Coursework from institutions that evaluate students with a narrative rather than numeric or alpha grade is not accepted.
- Completion of the acceptable General Chemistry sequence is required prior to admission consideration.
- All prerequisite coursework must be complete by August 1 of the year of matriculation.
- International students: To provide adequate time for completion of international student paperwork and visa processing, we require all prerequisite coursework to be completed at a United States institution and all transcripts received by our office no later than July 1 of the year of matriculation.
The PCAT is not required for consideration for admission.
Prerequisite Courses
- General Biology I & II with labs (Coursework in botany, ecology, entomology, anatomy or physiology will not fulfill the biology requirement.): 8 semester hours/12 quarter hours
- Human Anatomy (If enrolled in a combined anatomy/physiology course, 6 semester hours will be required.): 3 semester hours/4.5 quarter hours
- General Chemistry I & II with labs:* 8 semester hours/12 quarter hours
- Organic Chemistry I & II with labs:* 8 semester hours/12 quarter hours
- Calculus, Physics or Chemistry with Quantitative Analysis (pre-calculus, survey of calculus and brief calculus courses will not fulfill the requirement): 3 semester hours/4.5 quarter hours
- English (including Composition): 6 semester hours/9 quarter hours
- Speech (Must include public speaking.): 3 semester hours/4.5 quarter hours
- Psychology: 3 semester hours/4.5 quarter hours
- Economics (Macroeconomics, Microeconomics, or Introductory Economics): 3 semester hours/4.5 quarter hours
- Electives (Nine semester hours from humanities or behavioral or social sciences. Creighton undergraduate students must complete 6 hours of Theology among the elective hours.): 18 semester hours/27 quarter hours
*The chemistry and biology courses must be a two-semester, eight-hour or equivalent course sequence. A course sequence is considered to be a correlated pair of courses offering in-depth coverage of a specific field and must be at a level such that the courses would be acceptable as prerequisites to advance toward a baccalaureate degree in that discipline. For chemistry and biology courses, survey courses, courses without associated laboratories, courses designed for non-science majors or abbreviated courses targeted toward health science majors are not acceptable as prerequisite science courses.
Dates and Deadlines
Applications open in mid-July for students who would begin in August of the following year.
July 10: PharmCAS Launch Date
November 1: Preferred Deadline
November 1: CPPSP Deadline
December-January: PharmCAS Academic Update (Update Summer/Fall grades through PharmCAS)
June 1: Final Application Deadline
Candidates who are selected for interviews will be notified via email. Interviews will be scheduled from September through June.
Interviews
Personal interviews are required in the PharmD admission process. Qualified applicants will be notified via email if they are selected for an interview. Interview registration, if applicable, is available in your application portal.
Applicants can interview virtually or on-campus. On-campus interviews are offered at each campus. Applicants are encouraged to apply early but will receive full consideration for admission through the application deadline.
Candidates are encouraged to schedule a campus visit if they interview virtually.
Virtual group interviews are offered bi-weekly October – June.
Cost of Attendance, Tuition & Financial Aid
Learn more about PharmD tuition and fees, which vary by year.
Scholarships
Creighton University School of Pharmacy and Health Professions offers competitive scholarship awards to qualified PharmD candidates at the time of admission. Scholarship awards can range up to $100,000 for the duration, and they are divided annually throughout the four years of the program. The Office of Admission awards scholarships to at least the top 25% of the incoming class.
All admitted candidates will automatically be considered for scholarships and no additional application is needed. The entire application is reviewed, including overall grade point average, prerequisite math and science grade point average, quality of admission essays, interview performance and participation in service and leadership. Scholarships are awarded on a rolling basis, so applying early will maximize your consideration.
Additional Creighton Scholarship Opportunities
Once enrolled in the School of Pharmacy and Health Professions, pharmacy students can apply for additional scholarships on an annual basis. These scholarships range from $500 to full tuition in value and can be stacked on top of the initial merit award.
The Health Careers Opportunity Program (HCOP) is a federally funded grant that provides students from economically or educationally disadvantaged backgrounds an opportunity to develop the skills needed to successfully compete for, enter and graduate from health professional schools. HCOP will offer a scholarship (to cover tuition, fees, books and other related educational expenses) to students who matriculate or are currently in the professional schools of medicine, dentistry, pharmacy, physical therapy or occupational therapy.
Streamlined Program Entry: From Undergrad to PharmD
Creighton Preference
As a benefit to students who choose to enroll at Creighton University for their undergraduate studies, SPAHP offers preferred admission into the Doctor of Pharmacy program. The “Creighton Preference” is designed to give Creighton undergraduate applicants who meet certain criteria advantages, such as guaranteed interviews or standardized test waivers.
Creighton undergraduates are strongly encouraged to enroll in the Student Success pre-professional learning communities to further their understanding of the pharmacy profession, as well as to obtain helpful instruction on how to be a competitive applicant for admission.
The “Creighton Preference” is intended for students who:
- Do not gain admission via the CPPSP program
- Fail to meet the requirements needed to continue in the CPPSP Program
- Decide to apply to the Doctor of Pharmacy Program after enrollment in a different Creighton undergraduate program
- Did not have an early interest in pharmacy coming right out of high school
Benefits of the Creighton Preference include:
- Guaranteed interview with a 3.0 overall GPA
PCAT is not required for consideration for admission.
Preference criteria:
- Full participation in the Student Success Pre-Pharmacy learning community throughout the duration of enrollment in the College of Arts and Sciences, College of Nursing or College of Business
- Take ALL prerequisite coursework at Creighton University (Courses taken for college credit/advanced placement prior to high school graduation will not result in ineligibility; however, any prerequisite courses taken at other institutions after high school graduation will result in ineligibility)
- Submit a PharmCAS application by November 1 of the academic year prior to enrollment in the professional program
Fulfillment of basic requirements or participation in the Student Success program does not guarantee admission. Admission is based on academic and personal qualifications considered necessary for successful, competent practice as a pharmacist.
Candidates are also evaluated on fit between their personal goals and the mission and objectives of the program. In addition, prior education, work experiences, honors, awards, service to others and leadership activities serve to provide insight into a candidate’s commitment to lifelong learning and doctoral-level education. It is required that prospective students spend time observing pharmacists at work in their communities.

International Opportunities
Serve and learn with other pharmacy professionals in the Dominican Republic in the ILAC (Institute for Latin American Concern) Summer Program. During this faith-based service-learning trip, you’ll leave the comfort of your home to provide healthcare to those in need while learning the Dominican culture, language and lifestyle. You will work side by side with a team of dentists, physicians and nurses to provide care in the rural areas of the Dominican Republic. Students will receive an elective advanced pharmacy practice experience credit when participating in their fourth year or an elective course credit if they participate as a first to third year student as a clinic guide.
3 + 4 Dual Degree PharmD Program with ASU
Complete your undergraduate degree and PharmD in less time with the dual degree pharmacy program at Arizona State University (ASU) and Creighton. The program lets you earn your undergraduate degree at ASU and a PharmD at Creighton in Phoenix. In the end, you can finish both degrees in just seven years, saving a full year on a typical timeline.
Open to Undergraduates at ASU
During your time at ASU, you’ll complete your major requirements and Creighton’s PharmD program prerequisites. While at ASU, you’ll work closely with an admissions counselor to ensure you’re on track to apply to Creighton’s PharmD program.
Students usually apply to the Creighton PharmD program in their junior year at ASU. If accepted in the pharmacy program, students will begin taking pharmacy classes their senior year.
Admission Requirements
Formal admission in the PharmD program is contingent upon:
- The student’s final grade point average
- Completion of all prerequisites
- Completion of successful background check and drug screen requirements
- Evidence of required immunizations
- Evidence that the ASU degree will be satisfied prior to beginning the program at Creighton
Students must provide Creighton with satisfactory documentation of the preceding prior to a final decision by Creighton. Final acceptance into the PharmD program is contingent upon Creighton’s issuance of a written statement confirming acceptance.
Prior to admission to the PharmD program, a student must:
- Complete the required curriculum identified by ASU with respect to the student’s specific major at ASU with an overall cumulative average of 3.25 (on a scale of 4.0). Student must have at least a grade of C in all prerequisite courses to the PharmD program
- Complete all current requirements by Creighton regarding criteria for direct admission into the dual degree pharmacy program
- Be in good standing at ASU
Students should apply through PharmCAS, the Pharmacy Centralized Application Service.
Dual Degree Programs
Creighton offers two dual degree options for pharmacy students. A dual degree can give graduates a competitive edge in the workforce and wider career options. Doctor of Pharmacy candidates are also able to earn a Master of Business Administration (PharmD/MBA) or a MS in Pharmaceutical Sciences (PharmD/MS in Pharmaceutical Sciences). Students who choose to pursue a dual degree will begin the second program after their first year in the PharmD program. The academic path will differ per student, and their academic advisor will work closely with them to develop an individualized plan and determine which courses can count toward both degrees.

Advance Standing and Transfer Applicants
Creighton University will consider candidates for advance standing or transfer from another fully accredited pharmacy program.
Any candidate that has matriculated into another professional pharmacy program must provide a letter from the dean or designated school official at the prior pharmacy institution to be considered. This letter should state your standing in (or upon leaving) the professional pharmacy program and your eligibility to return if you are no longer enrolled. Interested candidates should submit a transfer evaluation request.
Upon review, the Office of Admission will follow up in one to two weeks to discuss transfer intent and eligibility for admission consideration. All advance standing/transfer candidates will be considered for admission through submission of a PharmCAS application and must also adhere to all entry-level requirements for consideration.
Creighton also invites visiting students to take flexible online courses to enhance their pharmacy education or career.
“Creighton has not only allowed me to grow professionally, but also in such a way that enables me to become the best version of myself.”
Cailin Pasion
Doctor of Pharmacy Candidate
Class of 2027

Creighton University School of Pharmacy and Health Professions’ Doctor of Pharmacy program is accredited by the Accreditation Council for Pharmacy Education. If you have any questions, the ACPE can be contacted at:
Accreditation Council for Pharmacy Education (ACPE)
190 S. LaSalle Street, Suite 3000
Chicago, Illinois 60603-3446
Phone: 312.664.3575
Fax: 866.228.2631
acpe-accredit.org
Connect with classmates, meet future pharmacists and more. Creighton offers a close-knit community and plenty of ways to get involved, whether you’re on campus or online. Browse pharmacy-related student clubs.
Pharmacy Graduation Rates
- Entry year - 2020, Graduation Year - 2024
- Enrolled Students: 103
- Graduating Students: On-time/Late: 82/7 (79.61%/6.80%)
- Currently Enrolled/Withdrawn or Dismissed: 0/14 (0%/13.59%)
- Entry year - 2019, Graduation Year - 2023
- Enrolled Students: 141
- Graduating Students: On-time/Late: 116/9 (82.27%/6.38%)
- Currently Enrolled/Withdrawn or Dismissed: 2/13 (1.42%/9.22%)
- Entry year - 2018, Graduation Year - 2022
- Enrolled Students: 146
- Graduating Students: On-time/Late: 114/17 (78.08%/11.64%)
- Currently Enrolled/Withdrawn or Dismissed: 2/13 (1.37%/8.90%)
- Entry year - 2017, Graduation Year - 2021
- Enrolled Students: 154
- Graduating Students: On-time/Late: 120/12 (77.92%/7.79%)
- Currently Enrolled/Withdrawn or Dismissed: 0/22 (0%/14.29%)
- Entry year - 2016, Graduation Year - 2020
- Enrolled Students: 149
- Graduating Students: On-time/Late: 122/8 (81.88%/5.37%)
- Currently Enrolled/Withdrawn or Dismissed: 0/19 (0%/12.75%)
North American Pharmacist Licensure Examination (NAPLEX) Pass Rates
- 2024 Graduates
- First-Time Attempts: 86
- Creighton Pass Rate: 87.2%
- Creighton Omaha Pathway Pass Rate (n=33): 90.9%
- Creighton Distance Pathway Pass Rate (n=53): 84.9%
- National Pass Rate: 77.5%;
- 2023 Graduates
- First-Time Attempts: 130
- Creighton Pass Rate: 75.4%
- National Pass Rate: 76.6%
- 2022 Graduates
- First-Time Attempts: 122
- Creighton Pass Rate: 83.6%
- National Pass Rate: 77.4%
- 2021 Graduates
- First-Time Attempts: 124
- Creighton Pass Rate: 87.1%
- National Pass Rate: 81.7%
- 2020 Graduates
- First-Time Attempts: 136
- Creighton Pass Rate: 94.9%
- National Pass Rate: 86.2%
Multistate Pharmacy Jurisprudence Examination (MPJE) Pass Rates
- 2024 Graduates
- First-Time Attempts: 87
- Creighton Pass Rate: 83.9%
- National Pass Rate: 76.6%
- 2023 Graduates
- First-Time Attempts: 191
- Creighton Pass Rate: 69.6%
- National Pass Rate: 71.8%
- 2022 Graduates
- First-Time Attempts: 191
- Creighton Pass Rate: 75.9%
- National Pass Rate: 72.6%
- 2021 Graduates
- First-Time Attempts: 201
- Creighton Pass Rate: 78.6%
- National Pass Rate: 75.5%
- 2020 Graduates
- First-Time Attempts: 217
- Creighton Pass Rate: 87.1%
- National Pass Rate: 78.5%
Graduate Placement Rates
- 2024 Graduates
- Employed Within the Profession of Pharmacy: 62.8%
- Employed Outside the Profession of Pharmacy: 2.1%
- Completing Residency/Fellowship: 22.3%
- Unemployed, actively seeking employment within the profession: 1.1%
- Unemployed, actively seeking employment outside the profession: 4.3%
- Lost to Follow-up: 7.5%
- 2023 Graduates
- Employed Within the Profession of Pharmacy: 59.1%
- Employed Outside the Profession of Pharmacy: 1.5%
- Completing Residency/Fellowship: 23.5%
- Unemployed, actively seeking employment within the profession: 8.3%
- Unemployed, actively seeking employment outside the profession: 0.8%
- Lost to Follow-up: 6.8%
- 2022 Graduates
- Employed Within the Profession of Pharmacy: 44.7%
- Employed Outside the Profession of Pharmacy: 1.6%
- Completing Residency/Fellowship: 23.6%
- Unemployed: 1.6%
- Lost to Follow-up: 28.5%
- 2021 Graduates
- Employed Within the Profession of Pharmacy: 53.2%
- Employed Outside the Profession of Pharmacy: 1.6%
- Completing Residency/Fellowship: 23%
- Unemployed: 3.2%
- Lost to Follow-up: 19%
- 2020 Graduates
- Employed Within the Profession of Pharmacy: 66%
- Employed Outside the Profession of Pharmacy: 2%
- Completing Residency/Fellowship: 23%
- Unemployed: 5%
- Lost to Follow-up: 5%
Note: Entering class of 2019 has one deceased student that is not accounted for.